
Make it make sense: a webinar on data visualization
- Workshop
- Public
- Partnership
· Time: – Online
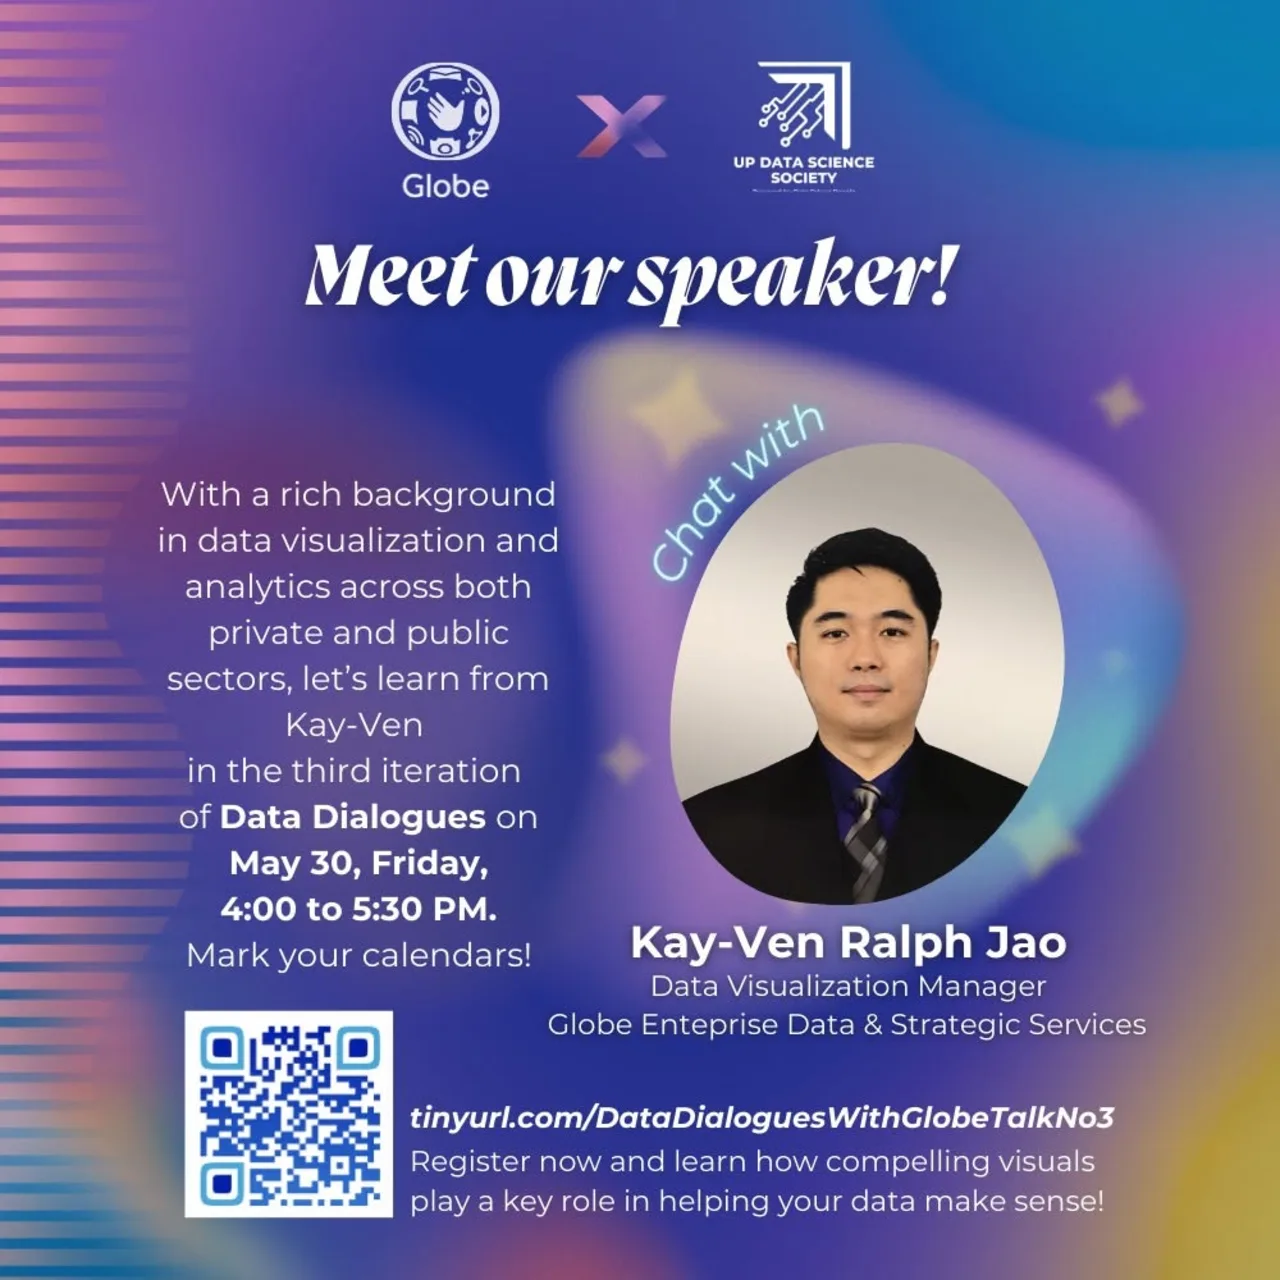
Read the announcement on Facebook“Make it Make Sense” was a webinar on data visualization held on May 30, 2025, from 4:00 PM to 5:30 PM. It was the third session of Data Dialogues, the talk series UP Data Science Society ran with Globe in 2025. The first session, announced in January, was a fireside chat with data professionals from Globe Enterprise, and the second, in March, was an overview of data management and governance.
The session was about the story behind a dataset and how charts, graphs, and illustrations bring it out. The announcement put it this way: a dataset does not have to be overwhelming, and a good visualization turns a pile of numbers into something a reader can follow.
Speaker
Kay-Ven Ralph Jao is the Data Visualization Manager at Globe, under Globe Enterprise Data and Strategic Services. He leads projects that turn raw data into working tools, among them the Micromarket Clustering Dashboard and automated reporting systems. He is a Ford Scholar with a master’s degree in Population Studies from UP and a BA in Sociology from Bicol University. Before Globe he built global reporting solutions at Accenture and supported policy work at DSWD and WHO. In the webinar he talked about his own path through the private and public sectors and about data storytelling through visualization.
Registration was through a form shared on the society’s Facebook page in the week before the session.