
DataSci Wrapped, a year in review for data science
- Project
- Web Development
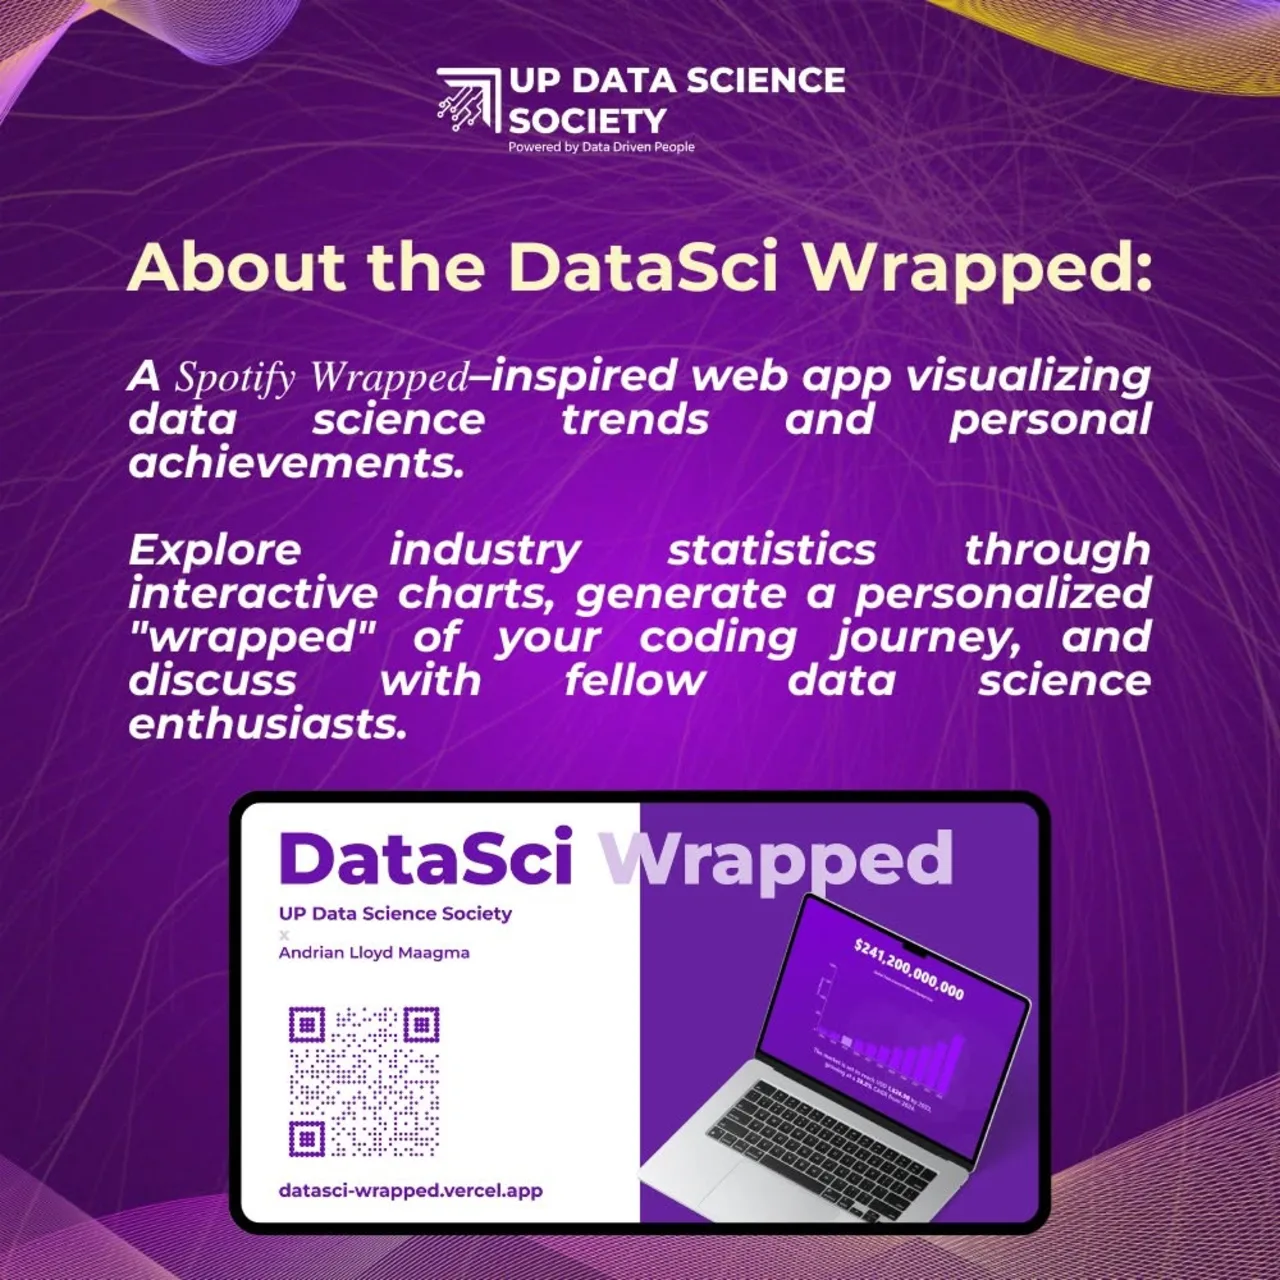
Top artist this year: Python. Top genre: data science. Minutes coded: best not to ask. That is the premise of DataSci Wrapped, a web app by Andrian Maagma that borrows the format of Spotify’s year-end summary and applies it to the field.
What it does
The app has two halves. The first is a set of industry statistics, presented as a slide-based, scroll-through story with interactive charts, covering how data science has grown around the world. The second is personal: connect your GitHub and Stack Overflow accounts and the app generates a wrapped of your own coding year. A discussion section lets visitors compare notes, and an FAQ and about page explain where the numbers come from.
How it was built
Andrian started by researching data sources, designing wireframes in Figma, and settling on a visual identity. The app itself is built with Next.js, React, and TypeScript, styled with Tailwind CSS and shadcn/ui, and animated with Framer Motion. Charts are drawn with Recharts. The personalized wrapped pulls from the GitHub and Stack Overflow APIs. Comments run through Giscus, which stores discussions as GitHub Discussions, and the site is deployed on Vercel with Google Analytics for traffic.
The site is at datasci-wrapped.vercel.app, and the source code is on GitHub.