
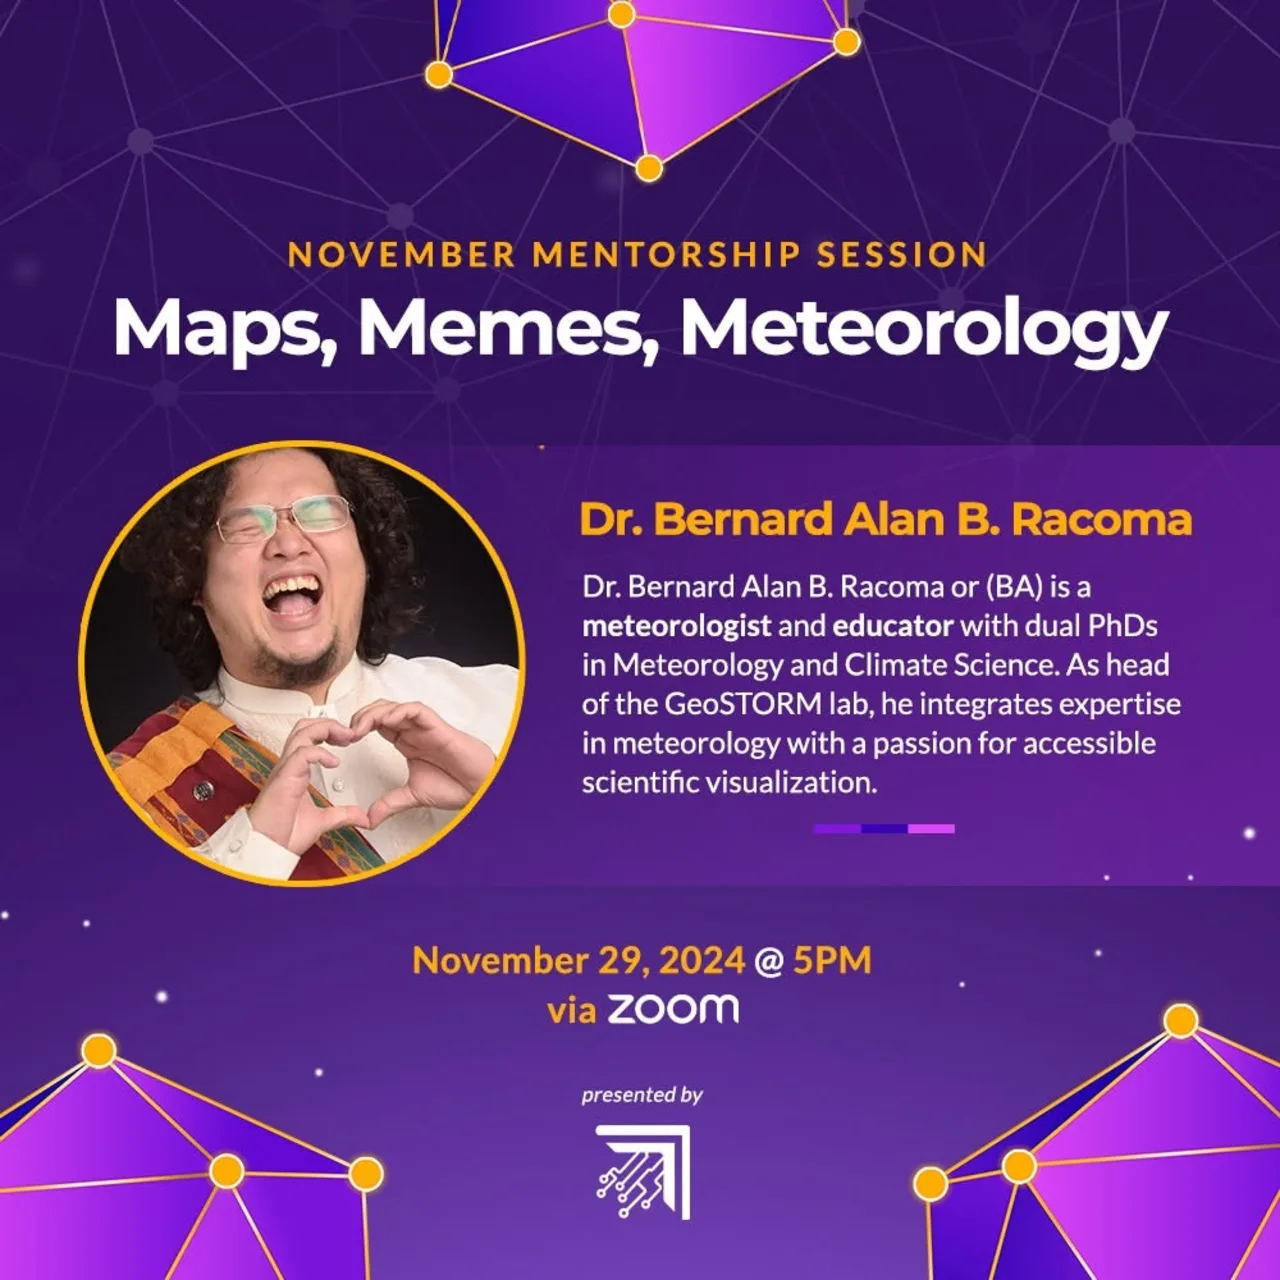
“Maps, Memes, Meteorology” was the first mentorship session of the semester, announced on November 27, 2024. It was held online on November 29, 2024 (Friday) at 5:00 PM over Zoom and livestreamed on the UP Data Science Society Facebook page.
The speaker was Dr. Bernard Alan B. Racoma, a meteorologist and educator with PhDs in Meteorology and Climate Science. He heads the GeoSTORM lab and pairs his work in meteorology with an interest in making scientific visualization accessible.
The session looked at where science and creativity meet. Weather and climate data are hard to read in raw form, and the talk showed how maps, charts, and even memes can carry a meteorological idea to people who are not scientists. Through examples and practical pointers, Dr. Racoma asked the audience to rethink how science should be communicated in a world where most people meet information visually first.
Topics covered:
- why visualization matters for public understanding of weather and climate
- examples of data visualization that bridge complex meteorological concepts and public understanding
- practical ways to communicate science visually
The session was open to the public through the livestream.